View the Punch List Dashboard

Background

Monitor and evaluate project-specific punch items using interactive visual graphs and summary charts. Visualizing metrics such as workflow status, responsible companies, average response times, and overdue items enables project teams to quickly identify bottlenecks and manage punch list items toward resolution.

Things to Consider

  • Required User Permissions:

    • 'Read Only' level permissions or higher on the project's Punch List tool.
Steps

  1. Navigate to the project's Punch List tool.

  2. Click My Items or All Items to view the dashboard.

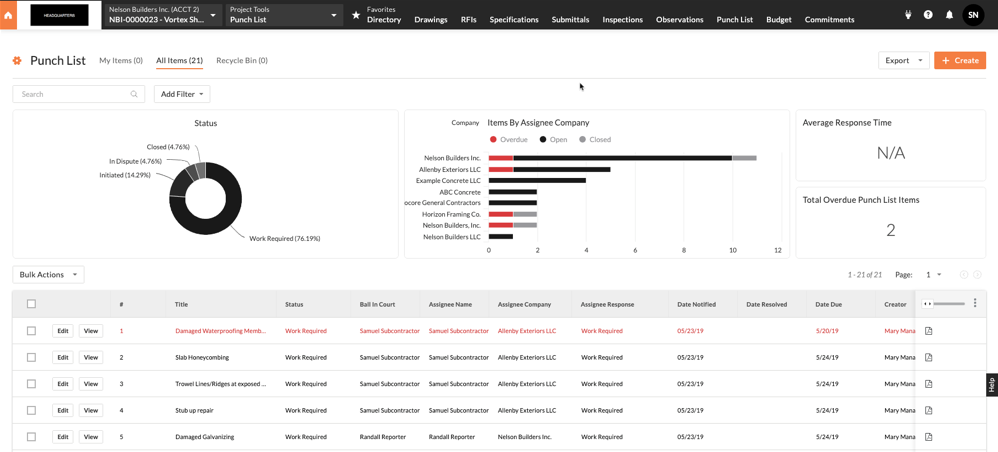
  3. Use the dashboard charts to track metrics:

    • Status. An interactive chart displaying the distribution of punch items by their workflow status.

    • Items by Company. An interactive chart displaying all assignee companies with punch items by status of Open, Closed, or Overdue.

    • Average Response Time. Displays the average response time of assignees for punch items by calculating the average number of days it takes a punch item to go from 'Work Required' to 'Ready to Review'.

    • Total Overdue Punch List Items. Displays the total number of punch list items currently Overdue.
      Punch List Dashboard

  4. Hover the cursor over chart elements to view specific data details.

  5. Select individual chart elements to filter and narrow the visible dashboard data.

  6. Apply filters to the dataset as needed:

    • Click Add Filter and select a filter category from the drop-down menu.

    • Select the checkbox next to each desired option in the drop-down menu to apply secondary filters.

  7. Click Clear All to remove any filters that have been applied to the dataset.

See Also

Loading related articles...