Expanded Adoption Report (Beta)
Beta
The Expanded Adoption report is currently in beta and is accessible in the Analytics tool.
The Expanded Adoption report is currently in beta and is accessible in the Analytics tool.
The Expanded Adoption report is powered by the User Adoption dataset, providing a comprehensive overview of adoption and usage patterns by teams throughout the Procore platform, including adoption of new tools such as Document Management, Scheduling, Connect, and more. This report serves as a single source of truth for tracking how teams utilize Procore tools, helping organizations gain a clearer understanding of the return on investment (ROI) from their Procore product suite.
You can customize the Expanded Adoption report to filter usage data by specific tools, track employee activity, and set target record generation percentages for external collaborators. See Configure an Expanded Adoption Report.
Documents
Reports
Tasks
Workflows
Budget
Change Events
Change Orders
Commitments
Direct Costs
ERP Integrations
Invoicing
Pay
Prime Contracts
Bidding
BIM
Coordination Issues
Estimating
Correspondence
Daily Log
Drawings
Forms
Instructions
Meetings
Photos
RFIs
Schedule
Specifications
Submittals
Transmittals
Action Plans
Incidents
Inspections
Observations
Punch List
Crews
Equipment
T&M Tickets
Timecard
Scheduling*
Timesheets*
Resource Planning*
Multicurrency*
Maps*
Insights*
Document Management*
Connect*
Analytics*
* Tools and features marked with an asterisk are new.
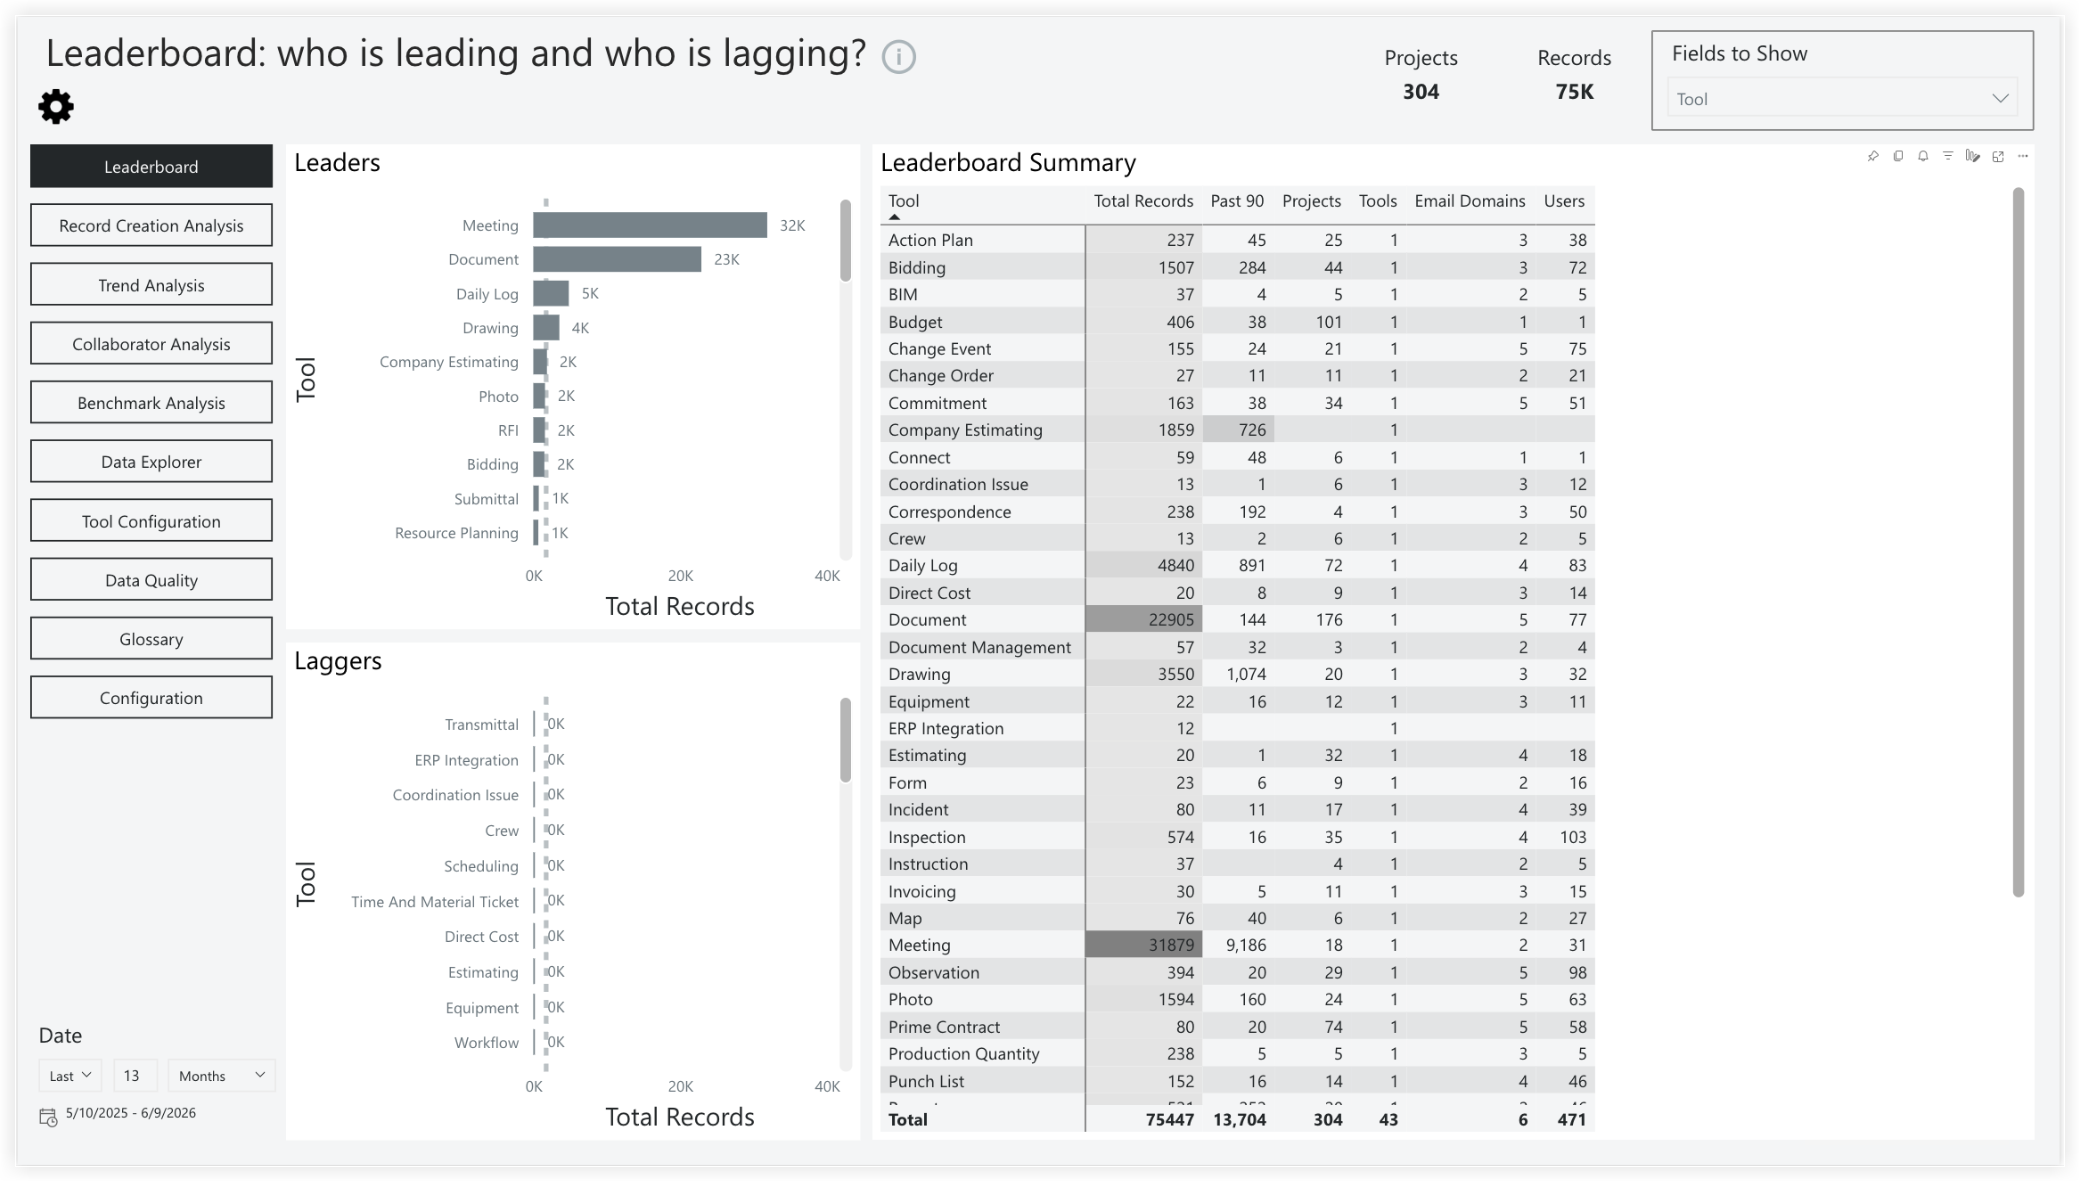
Leaderboard
The Leaderboard page provides a comprehensive view of which projects are leading the charge in leveraging Procore. You can also see which projects are lagging. Analyze your data by project, office, region, user, and many more fields to gain further insights.
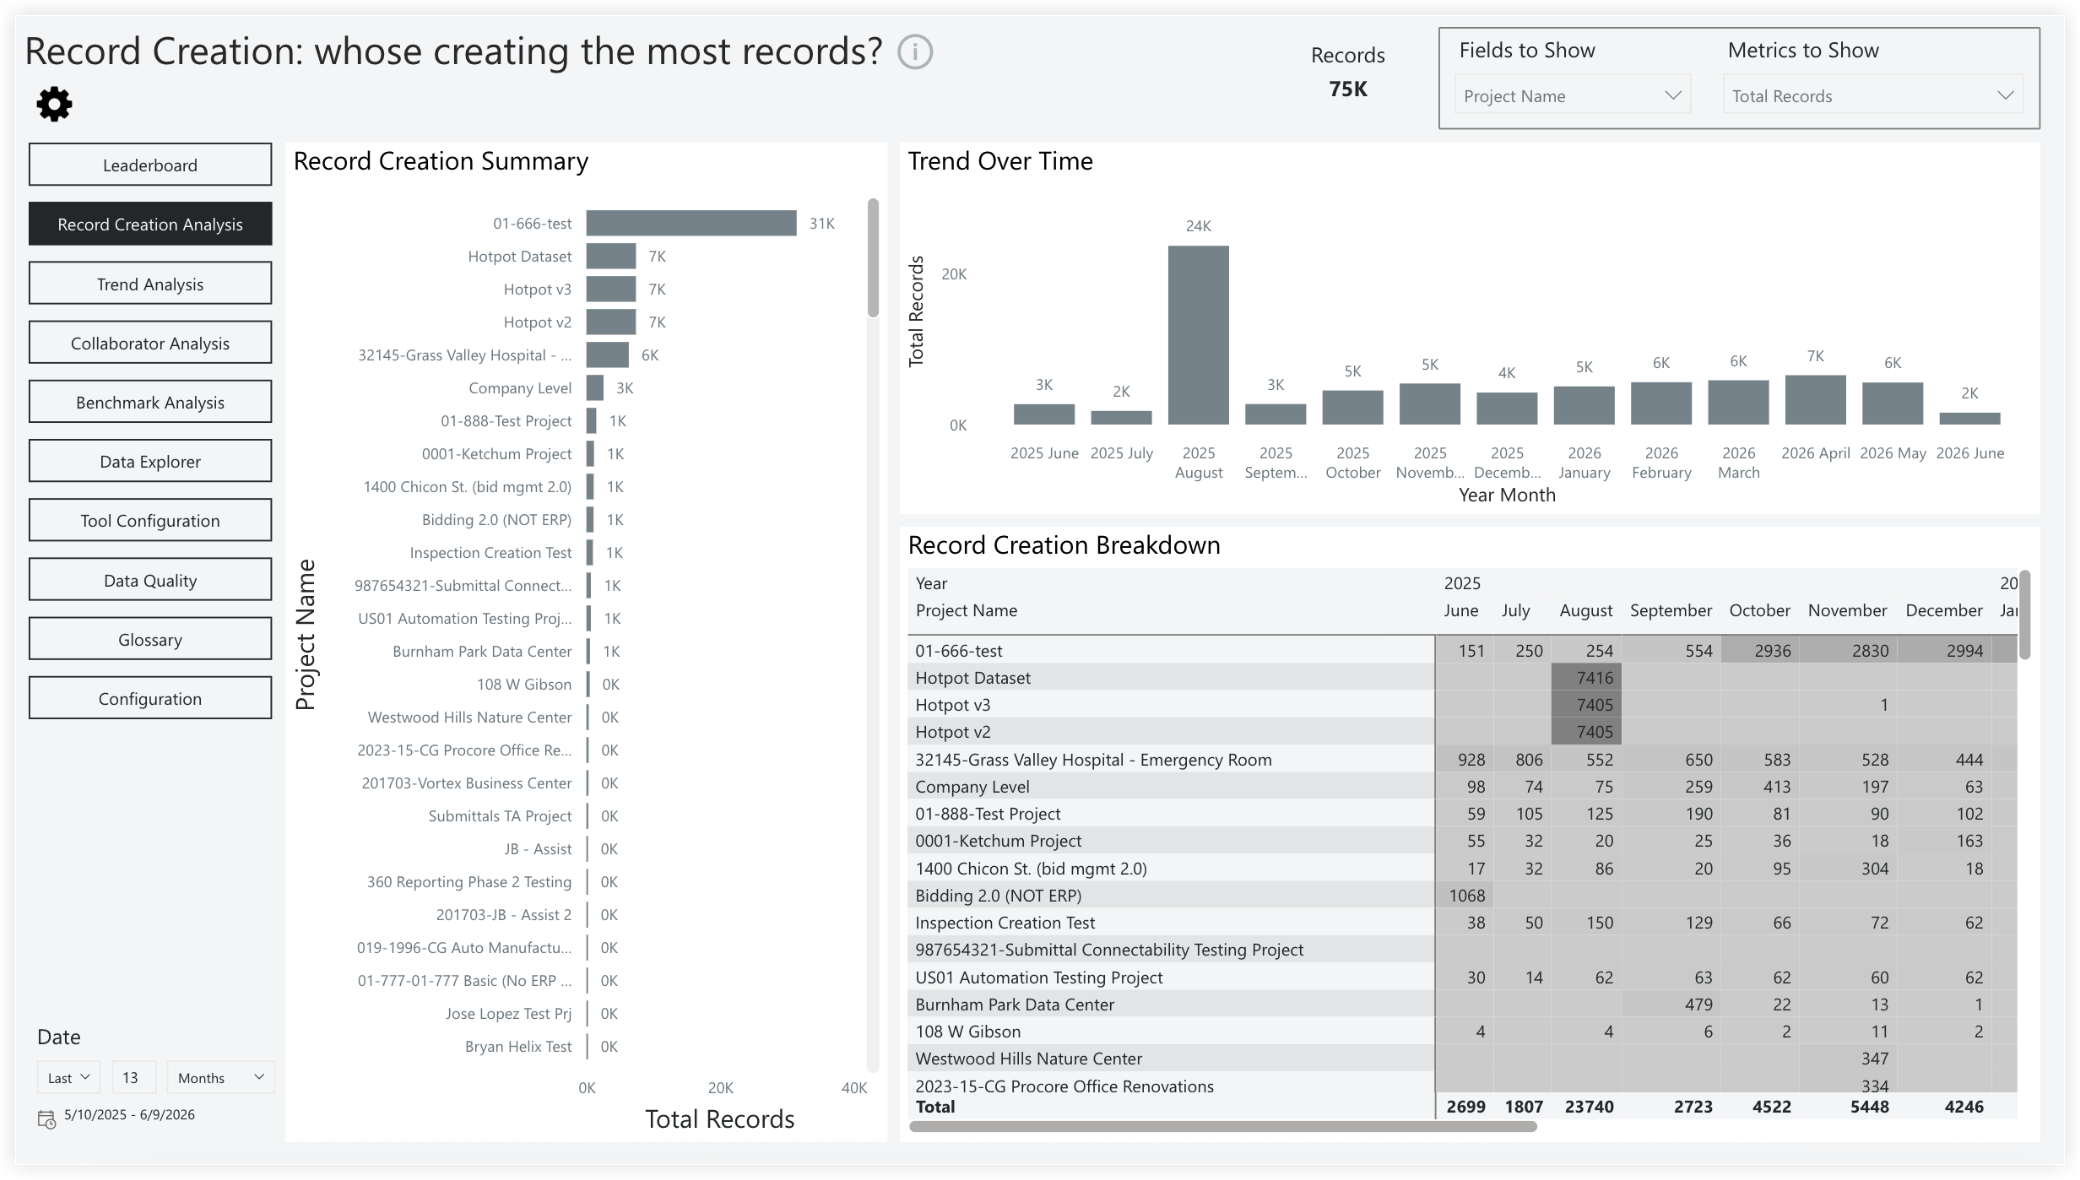
Record Creation Analysis
The Record Creation Analysis page is highly customizable, enabling deep analysis across a wide range of predefined metrics. Users can configure which metric they want to review and drill down into the underlying data.
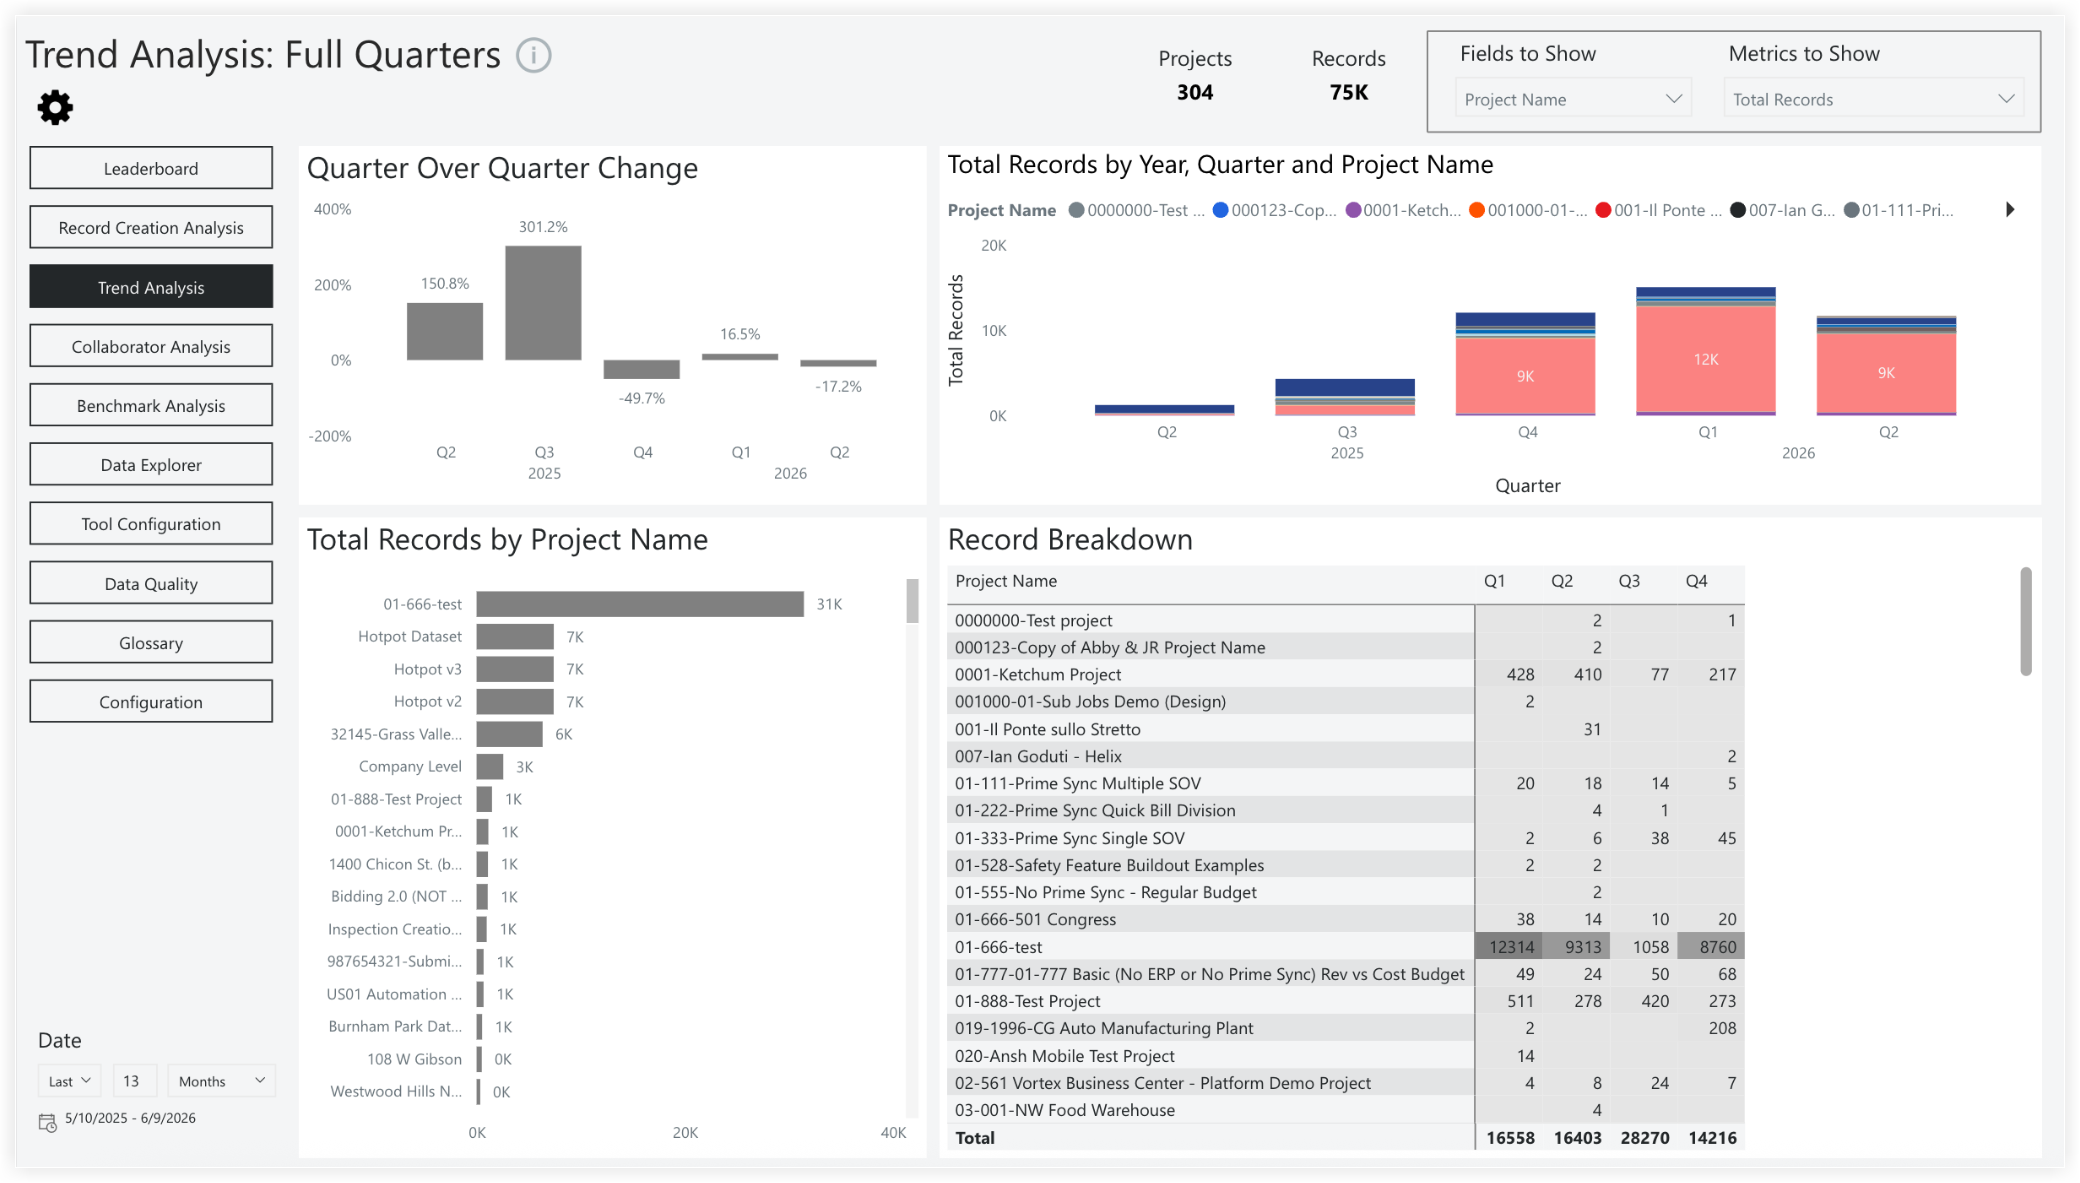
Trend Analysis
The Trend Analysis page displays quarter-over-quarter trends for your project metrics. Use the "Fields to Show" and "Metrics to Show" drop-down menus to customize your parameters and perform different analyses.
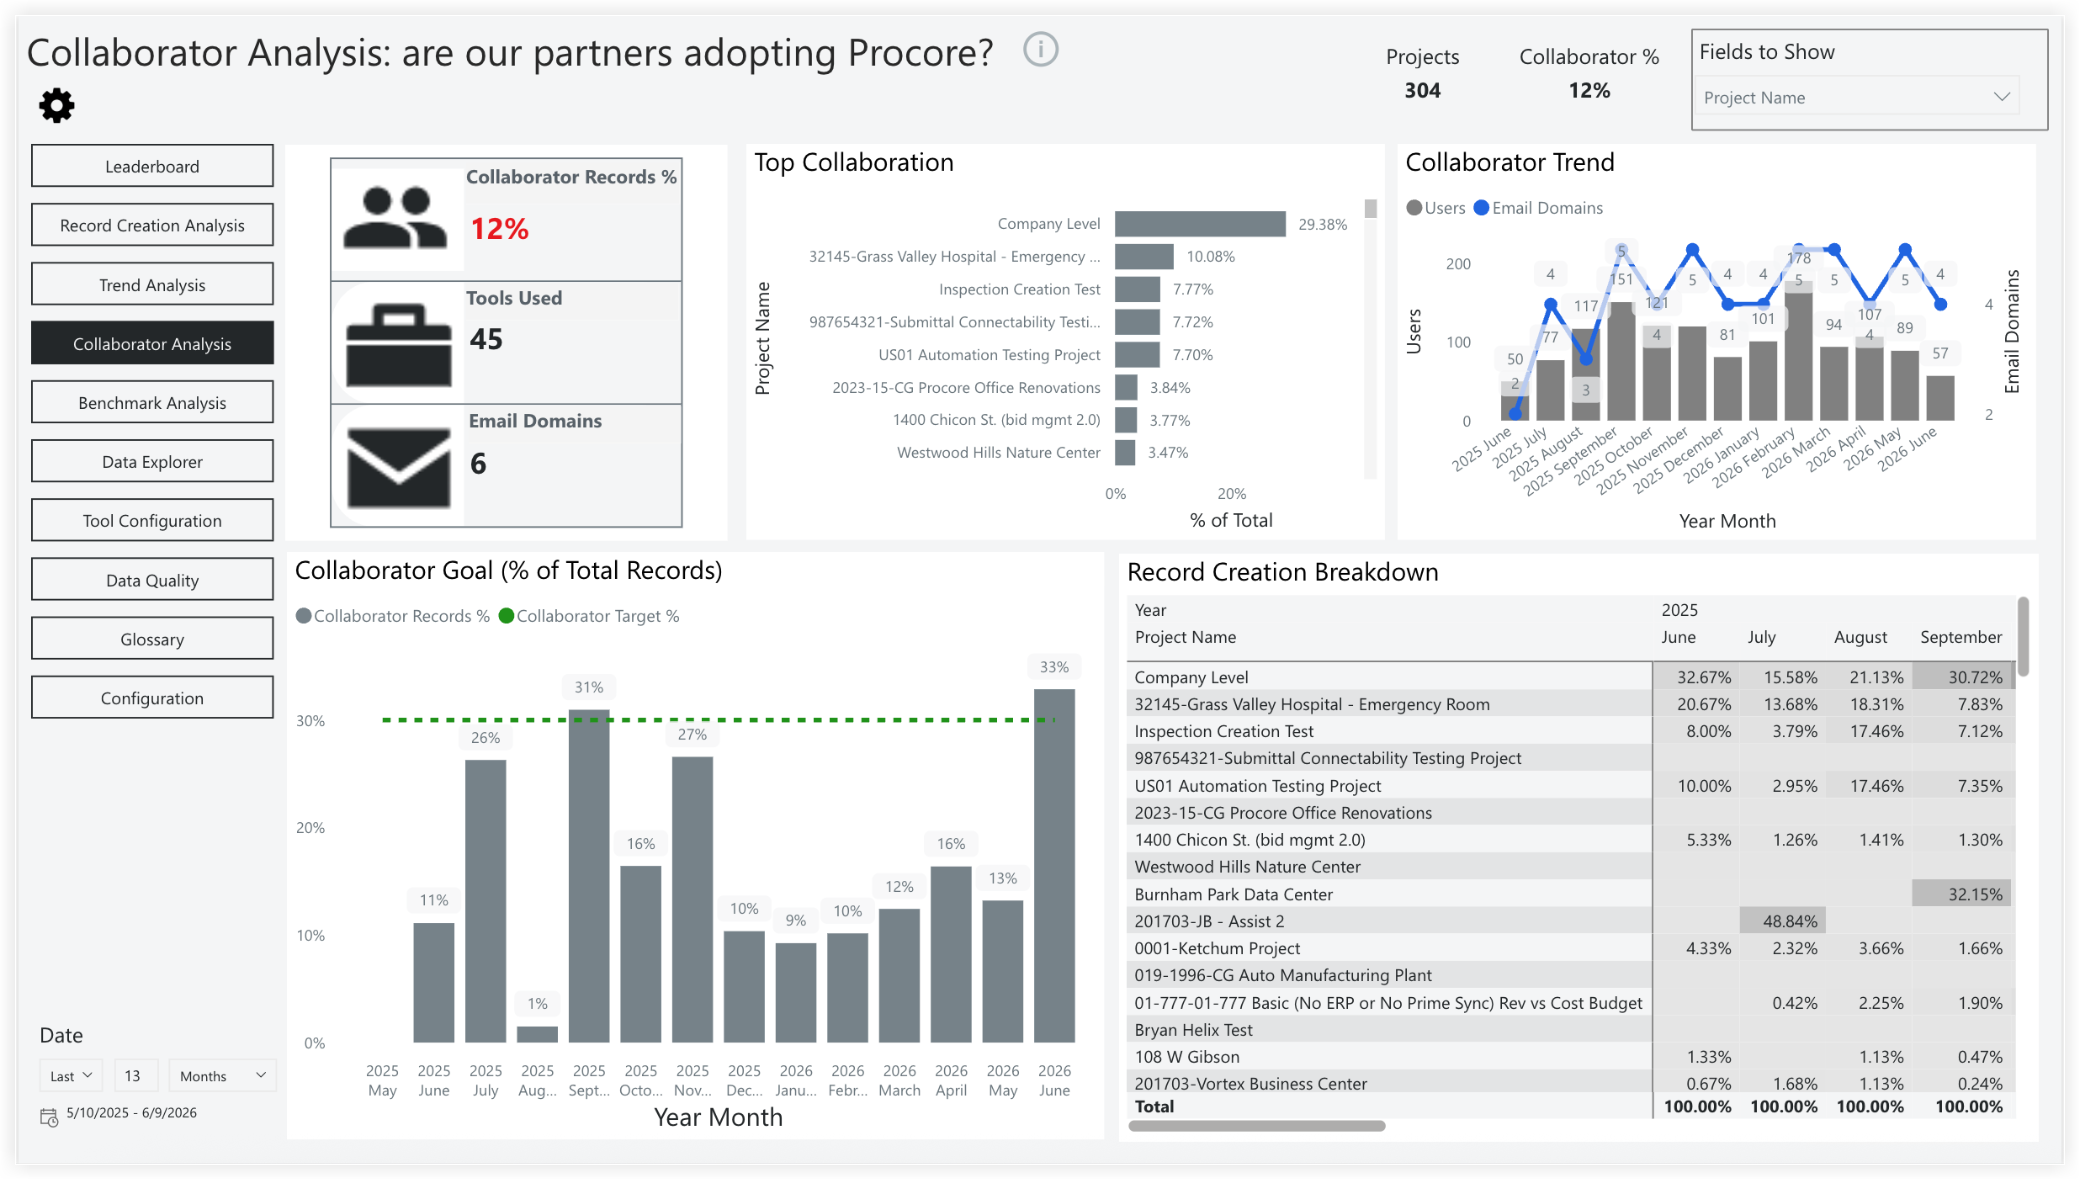
Collaborator Analysis
The Collaborator Analysis page lets you analyze how your partners or collaborators are leveraging Procore. This page allows you to set a target key performance indicator (KPI) to measure progress toward your goals for collaborator adoption. It can be used to facilitate discussions with your partners, ensuring that all your business processes and workflows are conducted within the Procore platform.
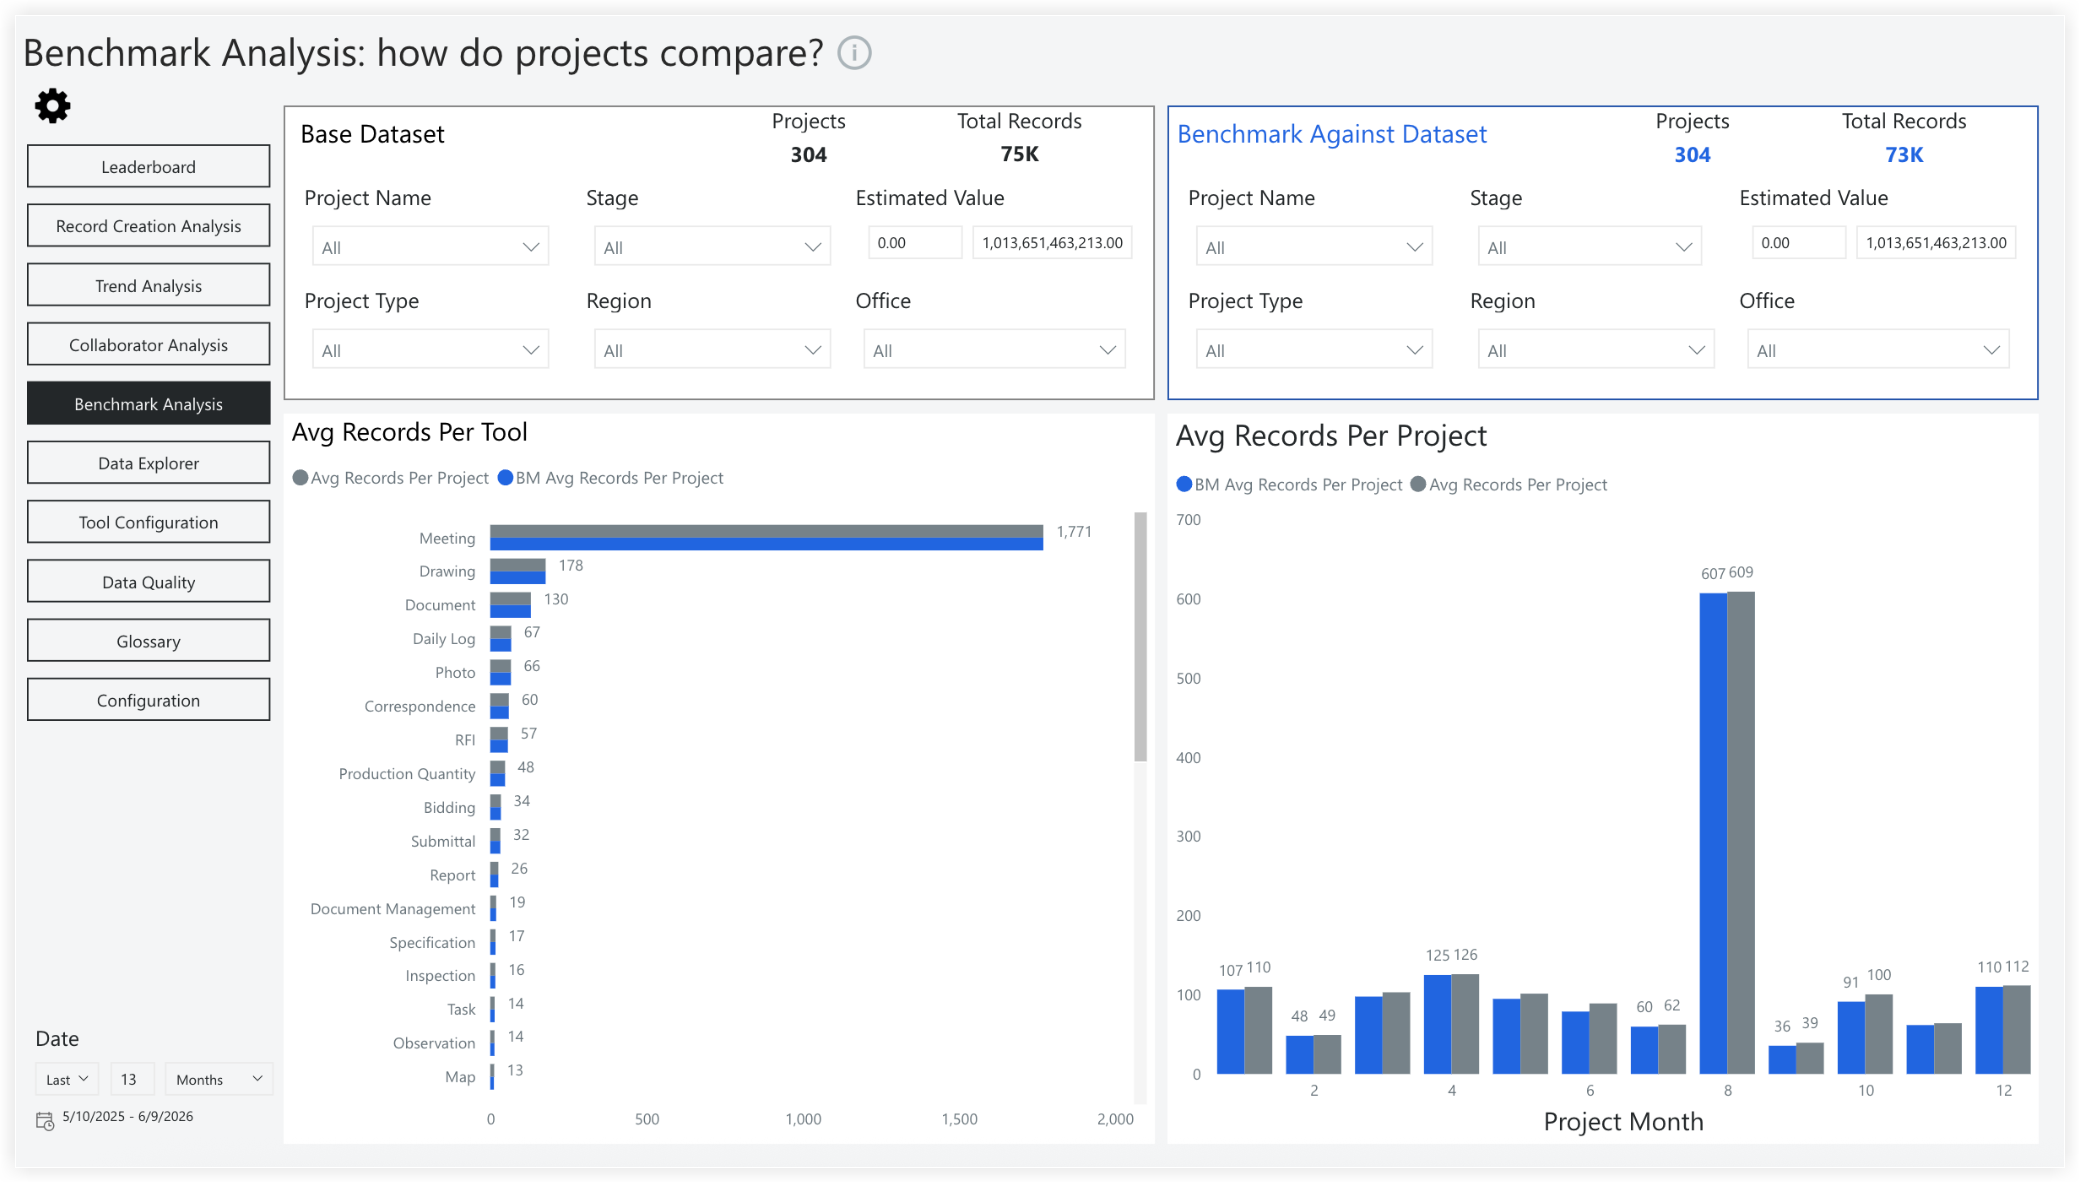
Benchmark Analysis
The Benchmark Analysis page is highly customizable and allows for the comparison of one or more projects against a set of benchmark data. This page enables you to compare your initial data set with benchmarks categorized by project, project type, office, square footage, and estimated project value. It helps you determine if an ongoing project is generating data similar to that of past projects of the same type.
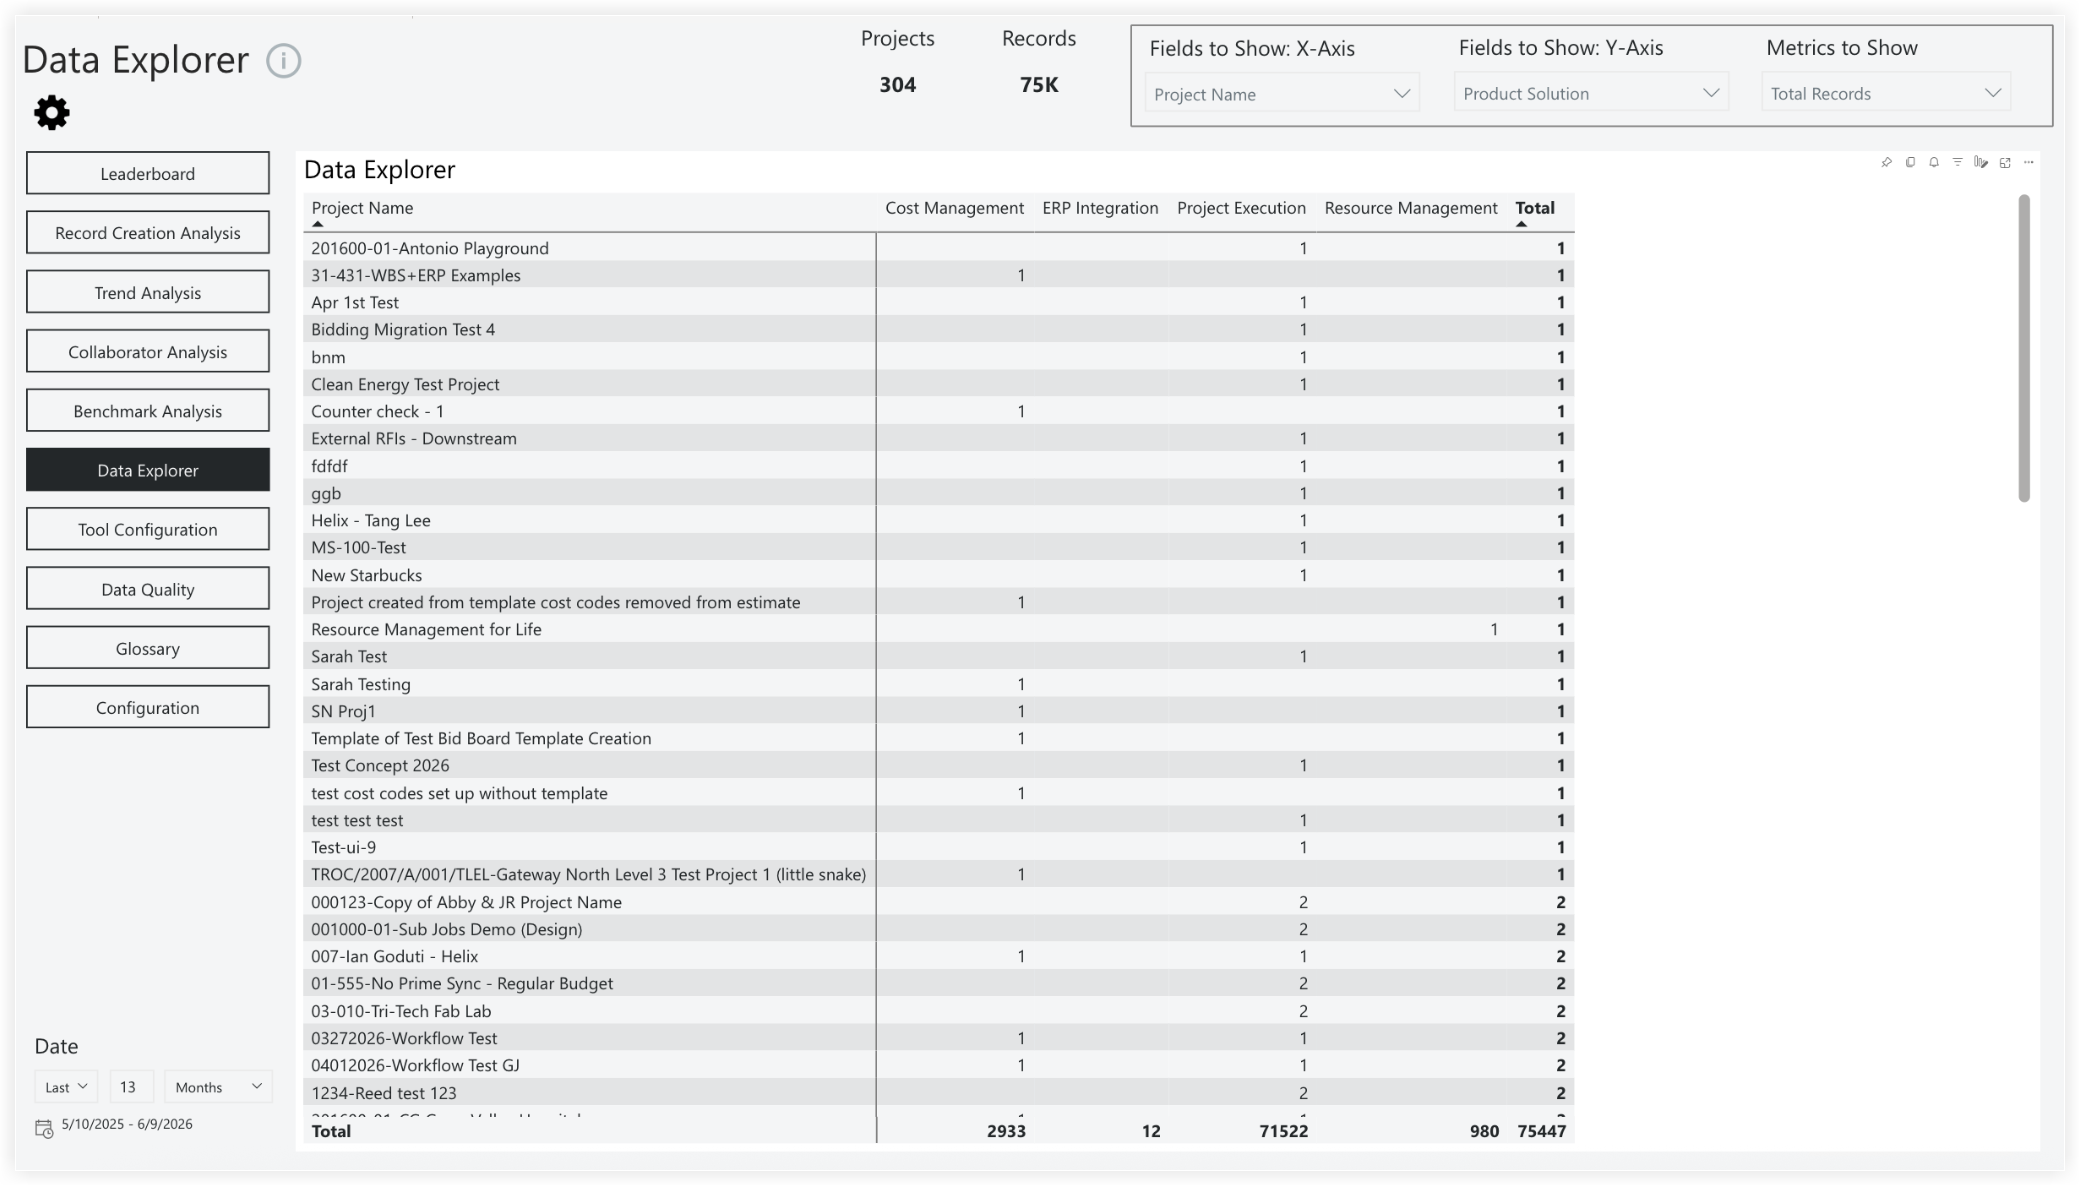
Data Explorer
The Data Explorer page provides a flexible method for cross-analyzing your data. Use the "Fields to Show: X-Axis", "Fields to Show: Y-Axis", and "Metrics to Show" drop-down menus to group your data and determine the values calculated in the table.
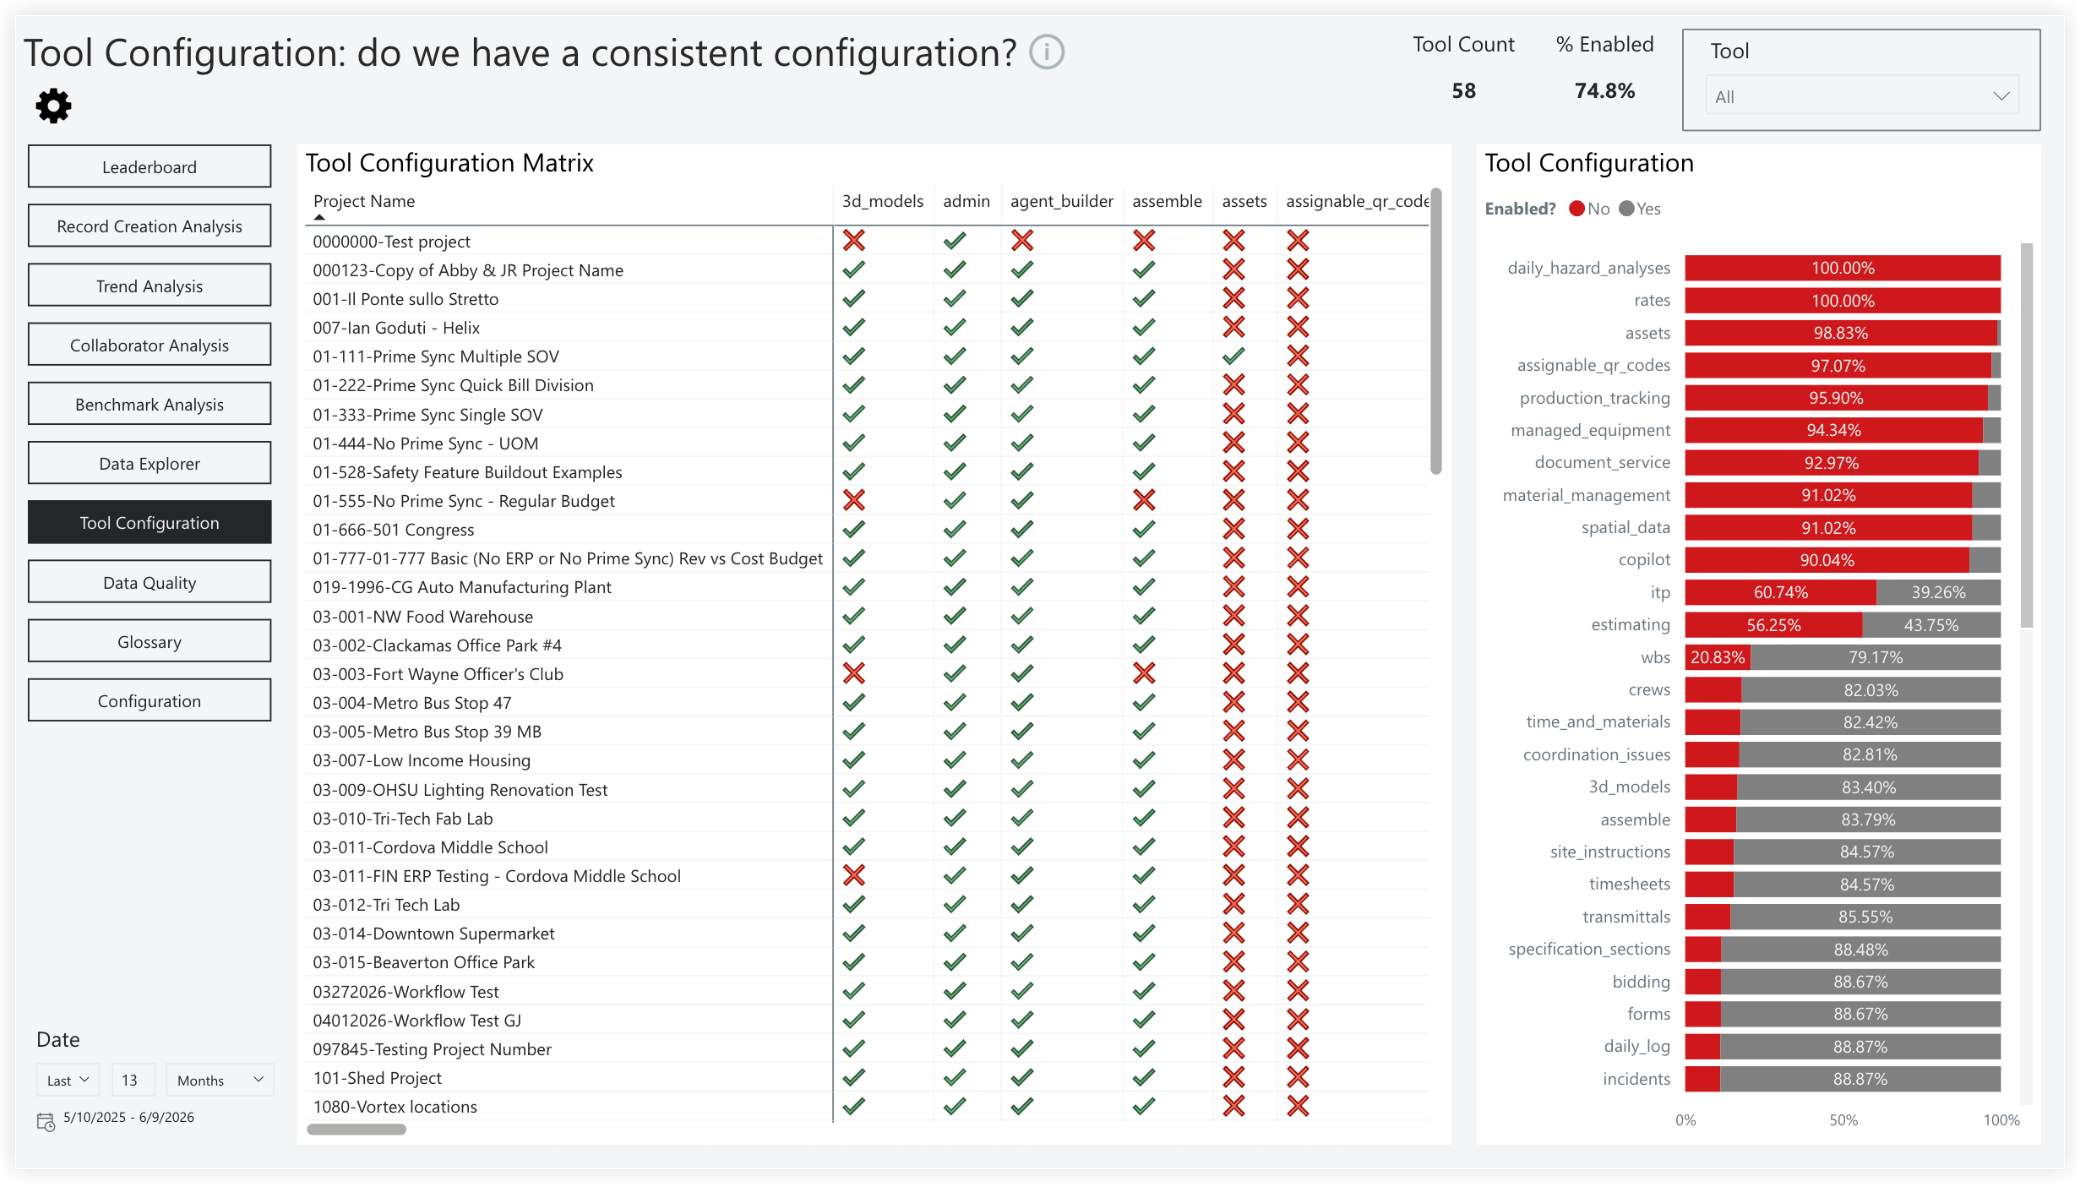
Tool Configuration
The Tool Configuration page provides insights into the consistency of tool deployment across your company's project portfolio. This page helps you evaluate setup consistency and track adoption metrics as tools are enabled across various projects.
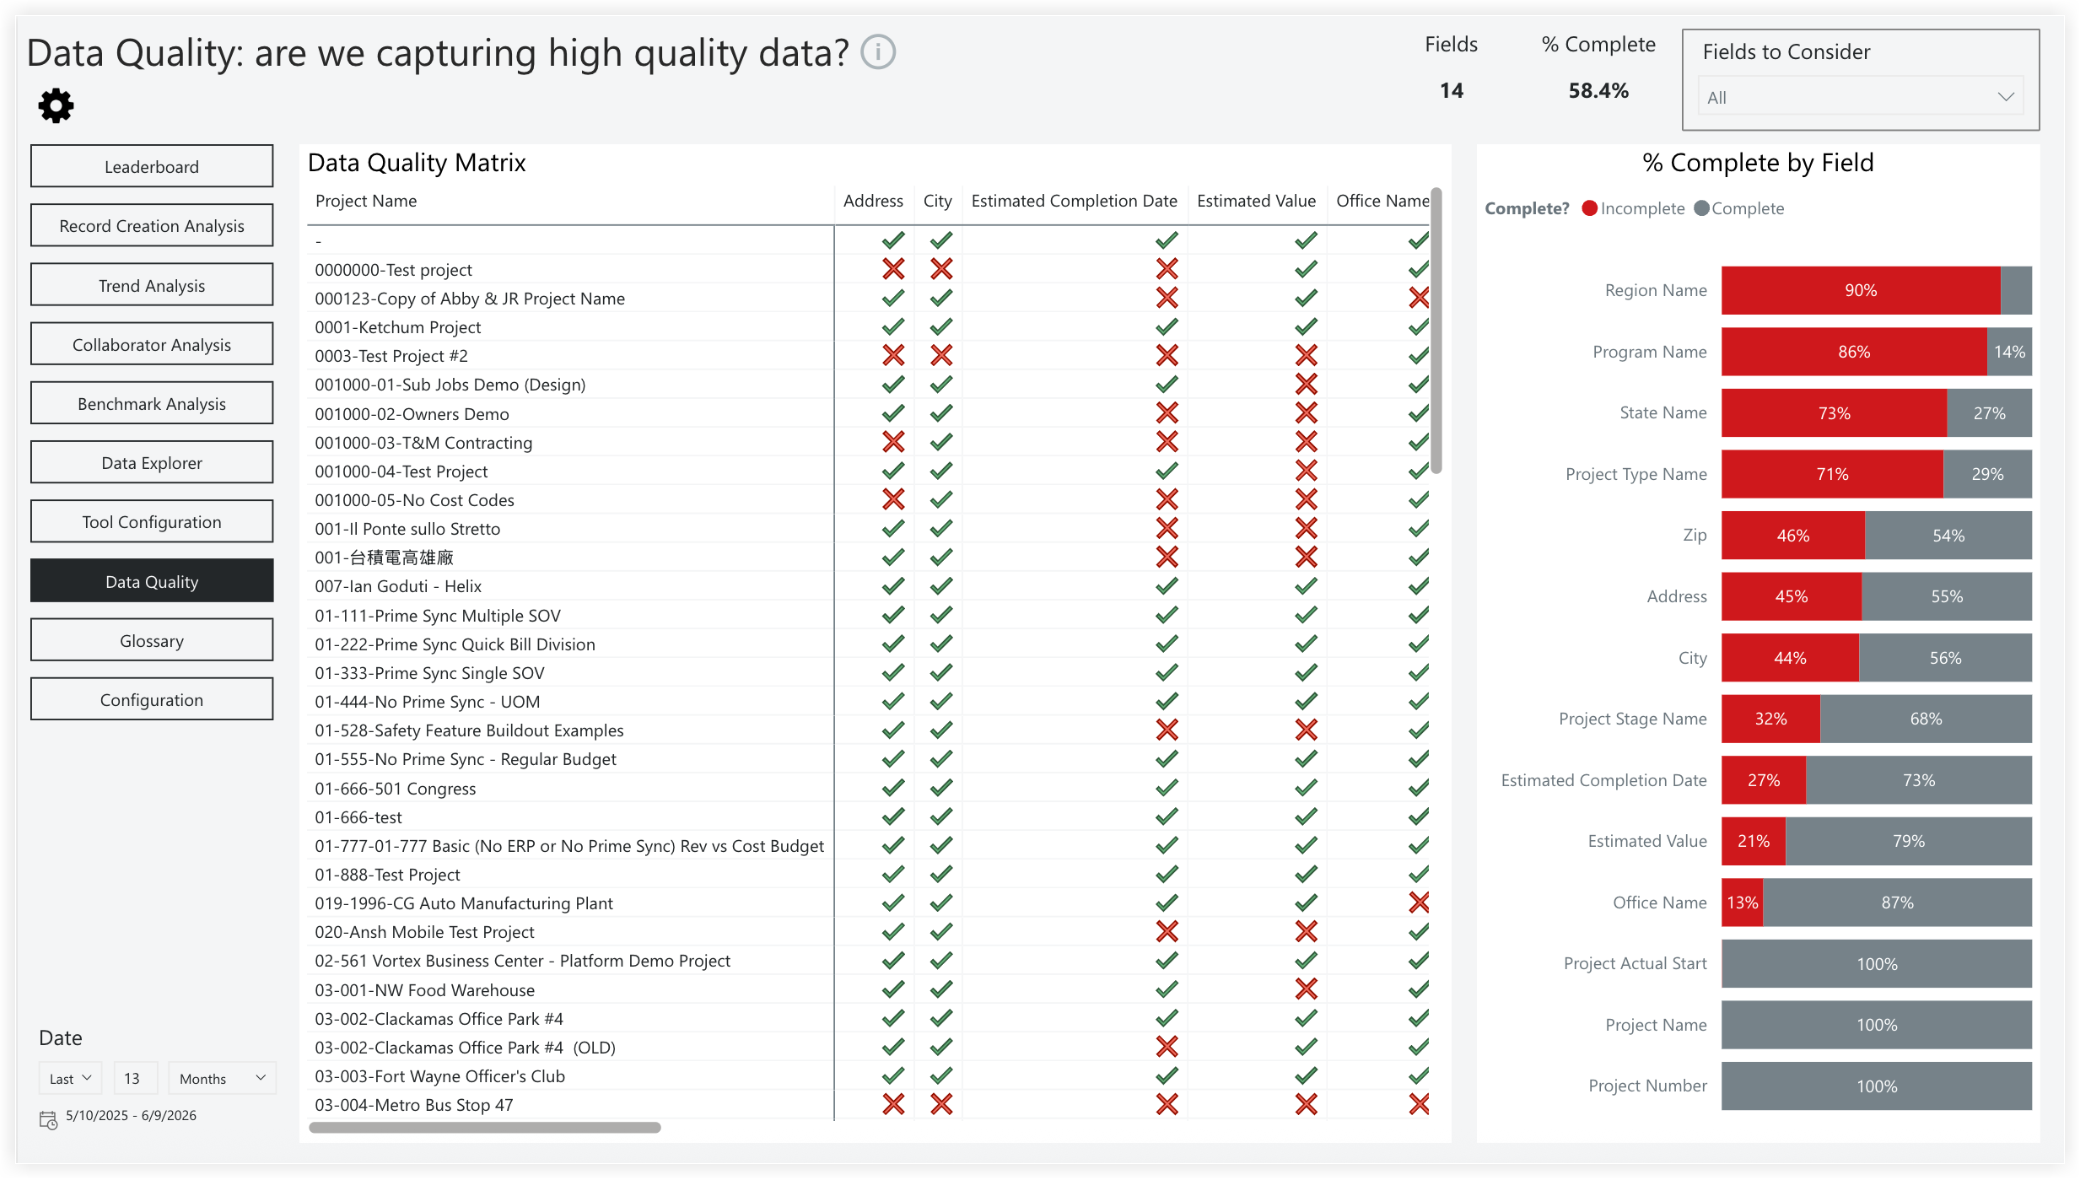
Data Quality
The Data Quality page allows you to monitor and assess data integrity across your project records. This page provides quick insights into missing data, enabling you to address these issues efficiently. By filling in missing values, you can unlock additional features such as benchmarking and trend analysis within Analytics.
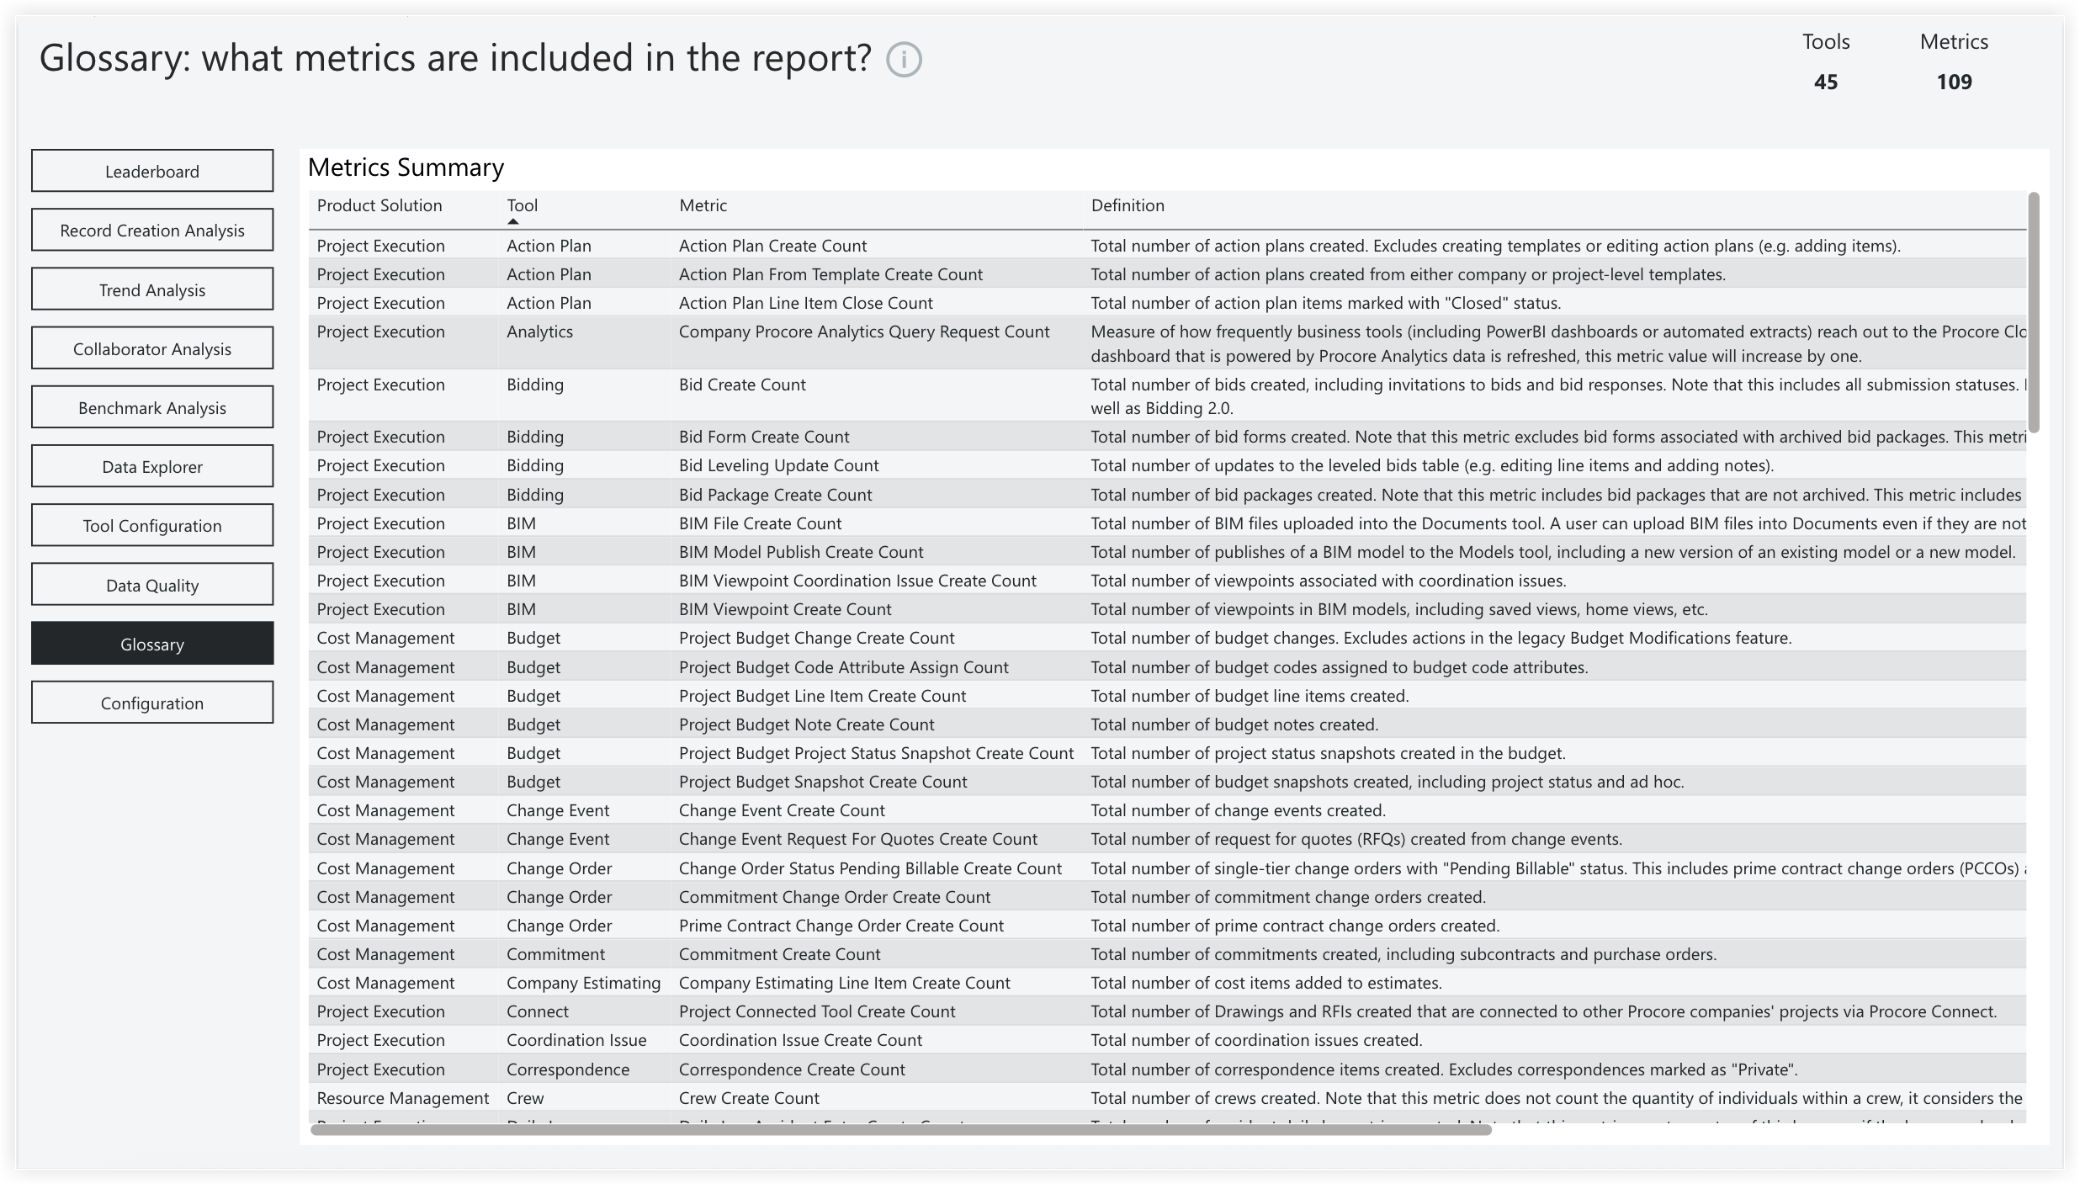
Glossary
The Glossary page provides a summary of each metric included in the report. This page includes refined column terminology to streamline analysis: Product Solution (formerly "Tool Rollup") and Metric (formerly "Tool Dataset").
Note: The legacy "Type" column is no longer available.
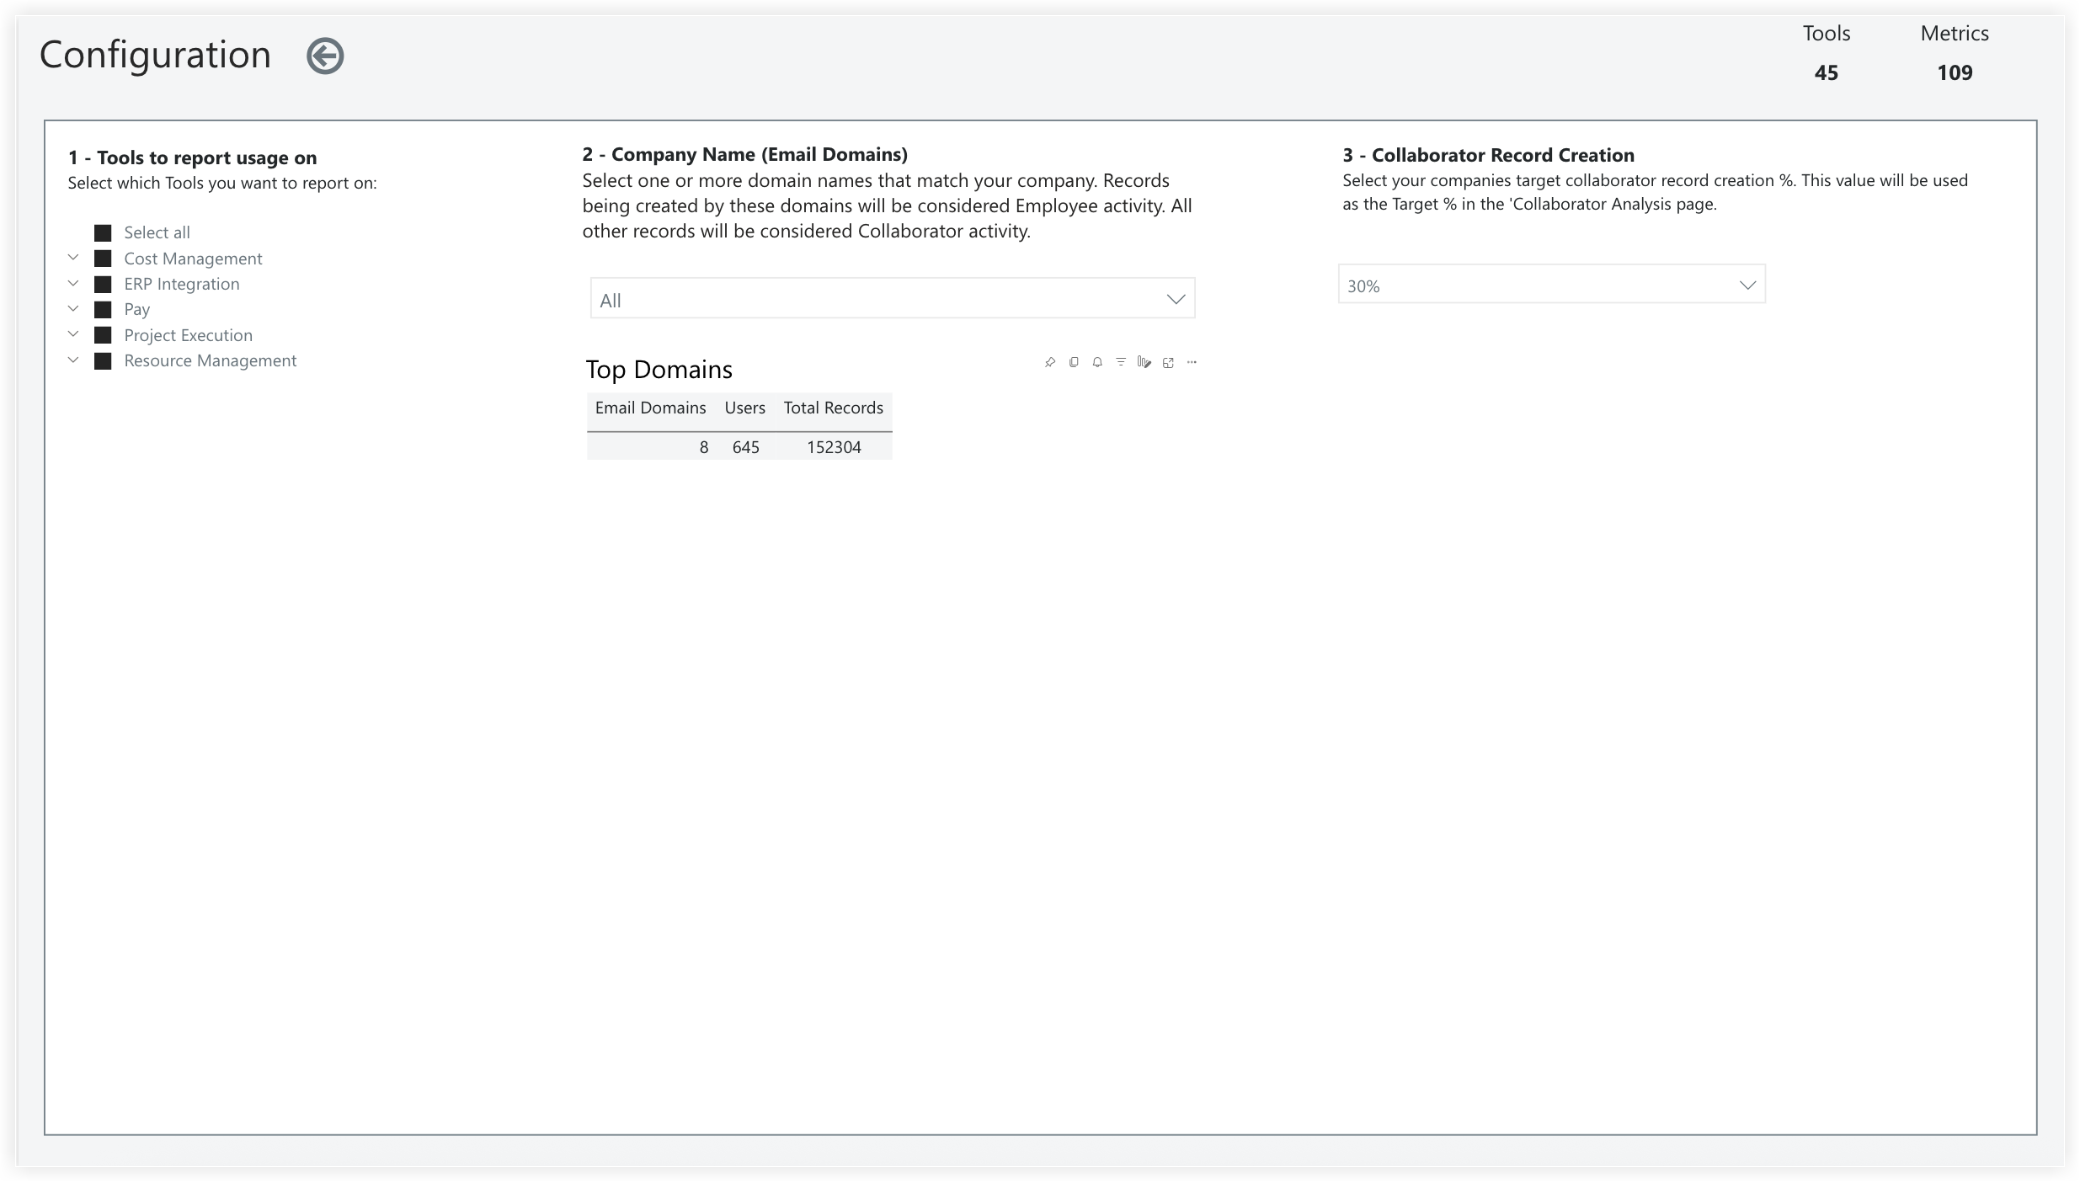
Configuration
The Configuration page provides three main administrative controls for customizing your data reporting. It allows you to select specific tools for tracking usage, define your internal email domains to filter employee activity, and set a target percentage for creating collaborator records. See Configure an Expanded Adoption Report.
Note: The target percentage for creating collaborator records is displayed on the 'Collaborator Analysis' page.